Search in documentation
Data Analysis: A Key Driver for Business Success in WooCommerce

Data analysis is a critical component for any business. By analysing data, you can gain valuable insights into customer behaviour, sales patterns and market trends. This information can then be used to make informed business decisions and optimise marketing strategies.
Why to track WooCommerce business data
One of the key benefits of data analytics is the ability to identify customer buying patterns and preferences. This information can be used to personalise marketing campaigns and tailor product offerings to specific segments of the customer base.
In addition, data analytics can be used to identify customer pain points and areas for improvement in the buying process, which can help increase customer satisfaction and loyalty.

Another important aspect of data analytics in WooCommerce is the ability to track sales and revenue. By analysing sales and revenue data, you can identify which products are performing well and which are not. This information can then be used to make decisions about which products to stock, how to price them and how to market them.
Data analytics can also help you to identify patterns in sales data, such as seasonal fluctuations, which can be used to make strategic decisions about inventory and production.
Data analytics can also be used to monitor and track the performance of marketing campaigns. By analysing data on the effectiveness of different marketing channels, you can identify which strategies are working and which are not. This information can then be used to adjust marketing budgets and allocate resources more effectively.
What are the options on the market
So it is important to have all this data at your fingertips. When we did market research with Futur Toolbox, we found that there was a lack of a dedicated data management and visualisation tool for WooCommerce.
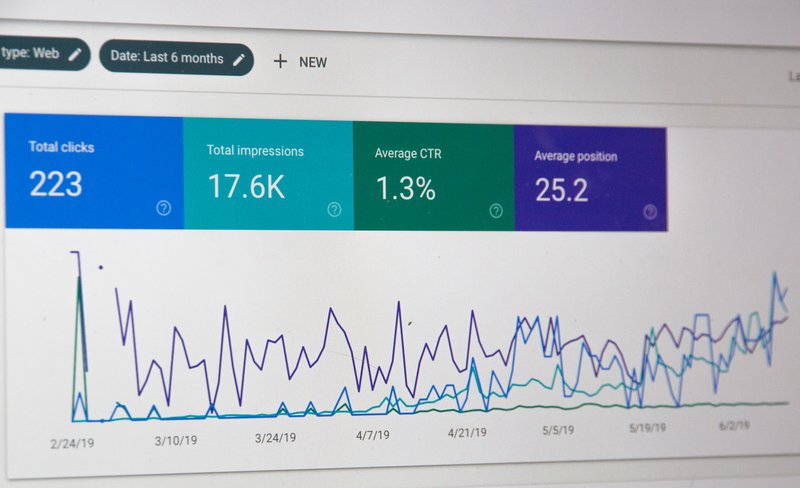
Yes, there is Google Analytics, but it focuses more on traffic than business. And the built-in WooCommerce dashboard doesn't even provide a basic framework for good business insight. The fact that it can't be shared is a huge drawback.
Business Data Analytics for WooCommerce
We thought long and hard about how we could add value to our customers – a simple and clear analytics tool that displays relevant metrics (especially ratios and context), works in a globally recognised environment, and can be shared easily and securely. And most importantly, it had to be built for WooCommerce.
The facts are clear. Almost everyone who works with computers and mobile devices uses or has used Microsoft Excel. It is currently used by over 750 million people worldwide. You can't go wrong with a sample size like that. The online version of MS Office is free, but the application packages are not. So we knew we had to create a version that was compatible with the online version of MS Excel.
Business Data Analytics for WooCommerce was born. It's a simple but powerful tool that helps you make informed decisions based on up-to-date data. And improve the performance of your WooCommerce store.

Maximum automation is provided by the Business Data Analytics plugin, which exports all the data in a pre-configured form. Just install, set up some basic data matching, date range and export. It's as simple as that. Copy the data to the appropriate place in Excel, refresh and you have all the data you need.
Benefits of Business Data Analytics for WooCommerce
In today's world, creating the same or a similar product would be a waste of energy for both customers and developers. That is why we joined forces with Toolbox and brought in a team of economists and people experienced in business and process management.
The result is a tool that differs significantly from competing solutions.
Data relevance
In addition to generally known data such as revenue, number of orders or average order value, it is worth monitoring a number of ratio indicators. These will tell you whether you are spending your time and energy on your business effectively.
For example, you'll know the percentage of revenue you've lost due to order cancellations or refunds, not just their value. You can then set targets for the percentage you don't want to exceed and plan specific steps to do so.
Or you might discover that you have too much money in work-in-progress orders and investigate the situation to see if there is a problem with suppliers or your own production.
You may be paying a flat rate to a payment provider whose services customers do not use at all. Or it takes more than 5 days to process an order. Maybe 70% of your visitors are using a mobile device to browse your e-shop and you need to look at your responsiveness. You can find out all this with Business Data Analytics for WooCommerce. And based on this data, you can make fully informed and targeted decisions.
Clarity
Because Business Data Analytics is divided into clear tabs (topics), you will not get lost. The data is not rewritten in a graph according to the selected parameters, but is always separate and clearly visible.
Data Security
Data is your most valuable asset. With Business Data Analytics for WooCommerce, it's always with you. Not in a static application, but you have complete control over who you share it with.
Sharing
Because it is an Excel document, you can share it however you like. Either send a physical document as an attachment to an email or instant message. Or use the collaboration feature directly from Microsoft. Or keep it for yourself.
You don't need to give anyone access to your e-shop administration or install role-restricted plug-ins.
Business Data Analytics plugin
This plugin is very easy to use. Here you will find all the information you need and instructions on how to use it.
Business Data Analytics for WooCommerce – Orders Dashboard
This application focuses on the data at the level of your WooCommerce orders. It serves as a great overview of your business performance. It is divided into several tabs.
Sales Performance tab
The performance of your sales will determine your future success in e-commerce. Therefore, it is important to keep track of the key performance indicators of your online sales.
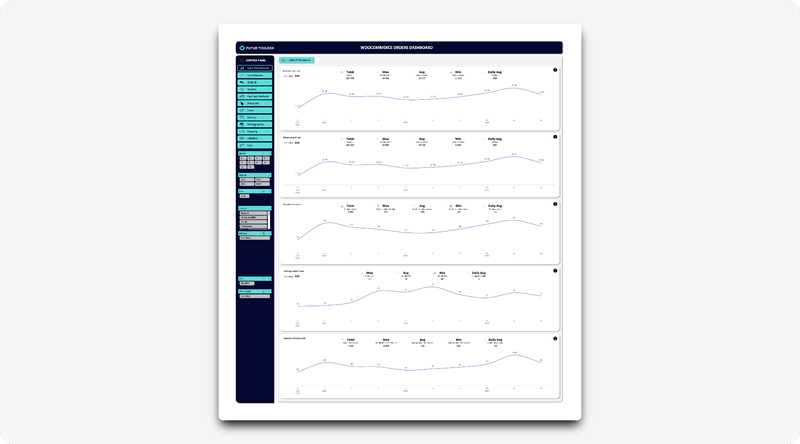
The "Sales Performance" tab of the Business Data Analytics for WooCommerce – Orders Dashboard shows you the key performance indicators of your e-commerce sales, which will help you get an overview, identify problems, show seasonality, but also positive patterns that are worth replicating in the future.
Sales Performance metrics
- Revenue including tax
- Revenue excluding tax
- Average order value
- Number of orders
- Number of items sold
Cancellations tab
Cancellations can have a significant impact on your bottom line. High cancellation rates can indicate problems with the shopping experience, product availability or your customer service.
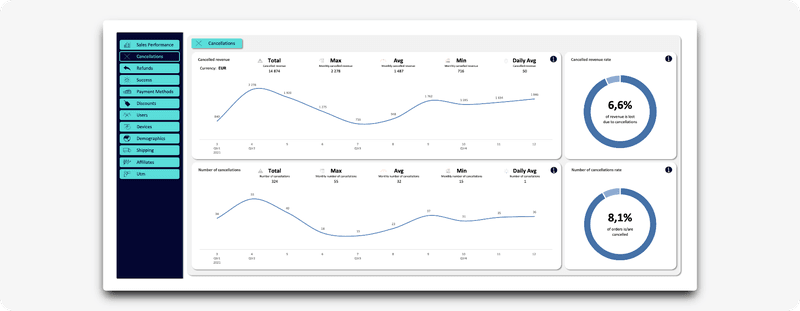
It is important to have your order cancellations under control, to know their levels and trends so that you can react in time. Thanks to Business Data Analytics for WooCommerce – Orders Dashboard, you get four key metrics to keep track of and make informed decisions. You can find your Cancellations data in the “Cancellations” tab.
Cancellations metrics
- Cancelled revenue
- Cancelled revenue rate
- Number of cancellations
- Number of cancellations rate
Refunds tab
It is essential to have control over your order refunds, to know their levels and trends so that you can react in time. Thanks to Business Data Analytics for WooCommerce – Orders Dashboard, you get four key metrics to keep track of and make informed decisions. You can find your refunds data in the “Refunds” tab.
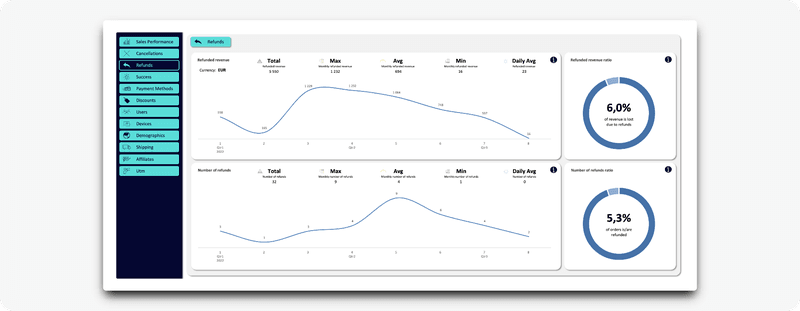
Refunds metrics
- Refunded revenue
- Refunded revenue rate
- Number of refunds
- Number of refunds rate
Success tab
We define success in e-commerce as a state where money comes into your business without you having to give it back. However, unsuccessful orders are inevitable. The more you sell, the more cancellations and refunds you will get. But it is important to keep them under control and gradually reduce their proportion.
In addition to refunds and cancellations, it is important to monitor this area:
- how much money you have allocated in pending orders
- how much money you have lost in the total number of already processed orders
- how many orders you have in the unfilled state
- how many of your total orders have you lost
- how long it takes you on average to process an order
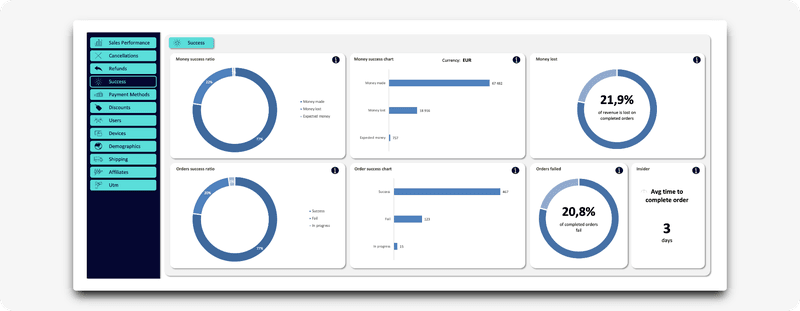
You can easily get all this information in the Business Data Analytics for WooCommerce – Orders Dashboard. In the tab with the characteristic name "Success".
Success metrics
- Money success rate
- Money success chart
- Money lost
- Orders success rate
- Orders success chart
- Orders failed
- Insider – average time to complete order
Payment methods tab
Offering a variety of payment options is important as it allows you to appeal to a wider customer base and increase the chances of a successful transaction.
In addition, offering secure and efficient payment methods can help build customer trust and loyalty. As technology continues to evolve, you need to stay informed and adapt to new payment methods to remain competitive and successful.
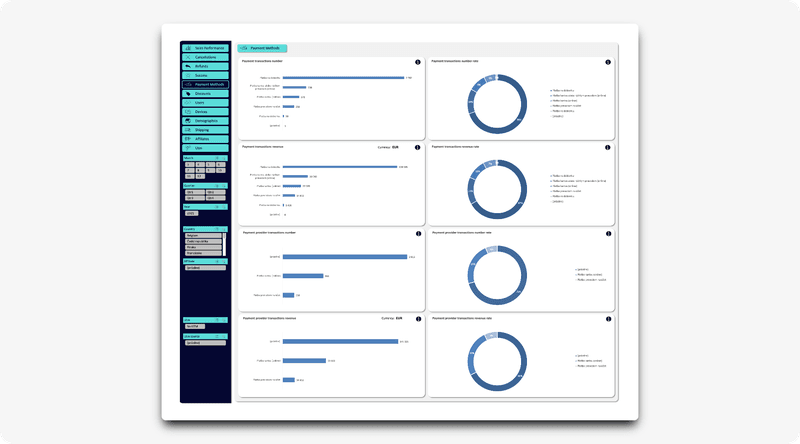
It is very important to keep track of payment data. WooCommerce offers almost no statistics in this area. But thanks to Business Data Analytics for WooCommerce – Orders Dashboard, you can find out everything you need to know. Just click on the "Payment methods" tab.
Payment methods metrics
- Payment transaction number
- Payment transaction number rate
- Payment transaction revenue
- Payment transaction revenue rate
- Payment provider transaction number
- Payment provider transaction number rate
- Payment provider transaction revenue
- Payment provider transaction revenue rate
Discounts tab
Your WooCommerce store gives you several ways to work with discounts. The most common is working with coupons, which gives your pricing a high degree of flexibility. However, the platform itself gives you minimal information about how much or little your coupons are used. And no information about what proportion of your total sales they account for.
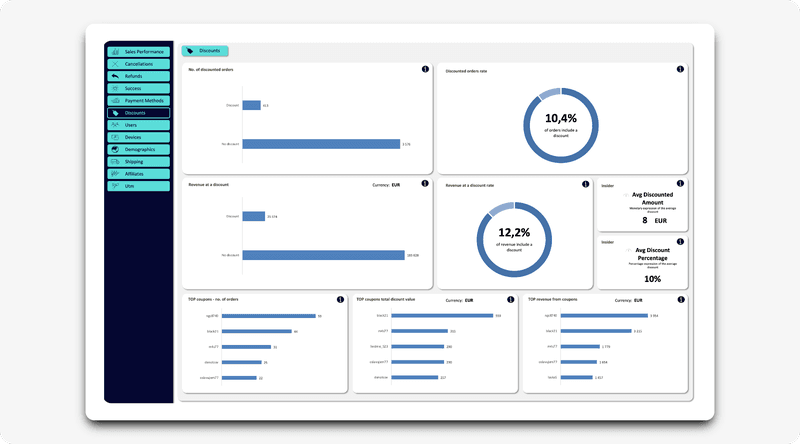
This problem is solved by the Business Data Analytics for WooCommerce – Orders Dashboard. With seven simple charts and two insider informations, you have everything you need in one place.
Discounts metrics
- Number of discounted orders
- Discounted orders rate
- Revenue at a discount
- Revenue at a discount rate
- Average discounted amount
- Average discount percentage
- Top coupons – number of orders
- Top coupons – total discount value
- Top revenue from coupons
Users tab
We recommend tracking the trend in the number of orders and sales from registered and unregistered users. Also their ratios, the trend in the number of registrations over time, and the user mix in terms of individuals vs. businesses.
In WooCommerce, it's not easy to find out the composition of your customers in terms of their registrations. As a result, you may be missing out on this important data.
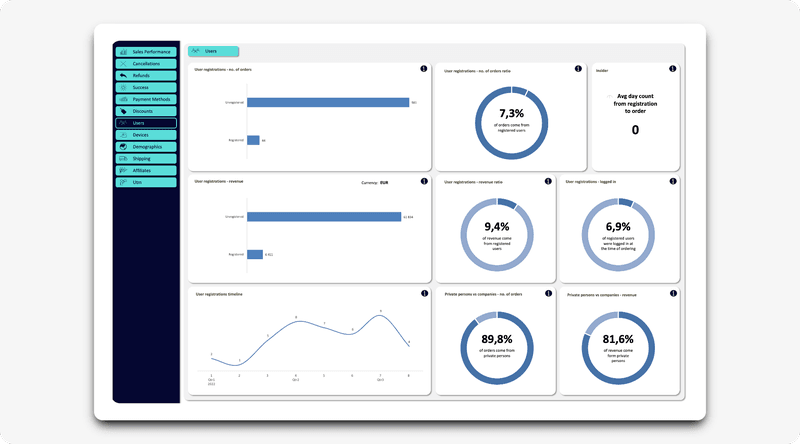
The Business Data Analytics for WooCommerce – Orders Dashboard gives you all the information you need in one place. It will help you gain greater insight and a relevant basis for your business decisions. Just click on the “Users” tab.
Users metrics
- User registrations – no. of orders
- User registrations – revenue
- User registrations – revenue rate
- User registrations timeline
- User registrations – logged in
- B2C vs. B2B – no. of orders
- B2C vs. B2B – revenue
Devices tab
Knowing what devices customers are using to access your e-commerce store is essential to understanding customer behaviour and improving the customer experience. By analysing device usage data, you can gain valuable insights into how customers interact with your website.
The perfect e-commerce store adapts to any screen size on a computer, tablet or mobile phone. Responsive web design ensures that your website gives your visitors the best possible experience, no matter what device they are using.
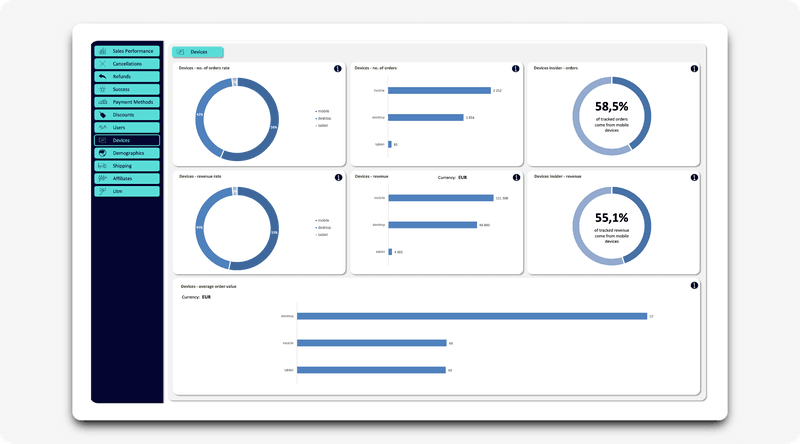
Do you know how your e-commerce site is performing in terms of the devices your users are using? Is it time for you to optimise responsiveness? WooCommerce won't tell you, but the Business Data Analytics for WooCommerce – Orders Dashboard has the solution – the “Devices” tab.
Devices metrics
- Devices – number of orders rate
- Devices – number of orders
- Devices insider – number of orders
- Devices – revenue rate
- Devices – revenue
- Devices insider – revenue
- Devices – average order value
Demographics tab
Knowing where your customers come from is essential to your business success. Even if you only operate in one country. When it comes to business processes, this demographic information is an important data point, for example when choosing the right carrier for your goods and planning transport costs.
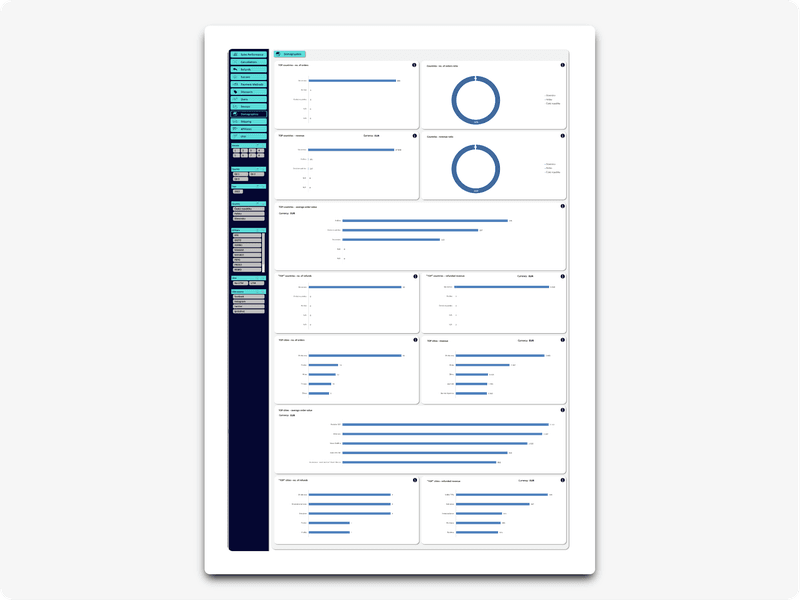
With Business Data Analytics for WooCommerce – Orders Dashboard, we use the data that is part of your orders. The “Demographics” tab gives insight into where your customers come from, which cities or states are strong in terms of orders and sales, and where your customers are most likely to return goods.
Demographics metrics
- TOP countries – number of orders
- Countries – number of orders rate
- TOP countries – revenue
- Countries – revenue rate
- TOP countries – average order value
- “TOP” countries – refunds
- TOP cities – number of orders
- TOP cities – revenue
- TOP cities – average order value
- “TOP” cities – refunds
Shipping tab
WooCommerce does not collect a lot of data about shipping. In fact, there is very little. However, we have tried to make the most of it. The shipping data and metrics that are automatically calculated in the Business Data Analytics for WooCommerce – Orders Dashboard are relevant to your e-commerce business. You can find them in the “Shipping” tab.
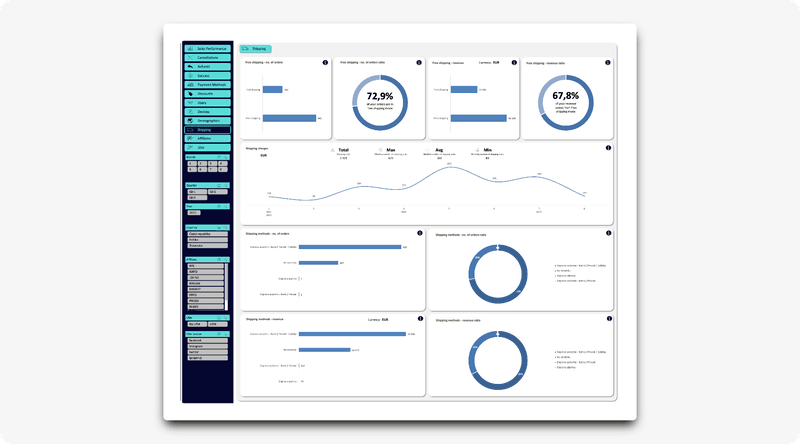
Shipping metrics
- Free shipping – number of orders
- Free shipping – number of orders rate
- Shipping charges
- Shipping methods – number of orders
- Shipping methods – number of orders rate
- Shipping methods – revenue
- Shipping methods – revenue rate
Affiliates tab
Affiliate marketing allows you to effectively sell products at low cost, with little effort and time, and with a well-managed level of risk. It also guarantees a high return on investment, increased brand awareness and business growth.
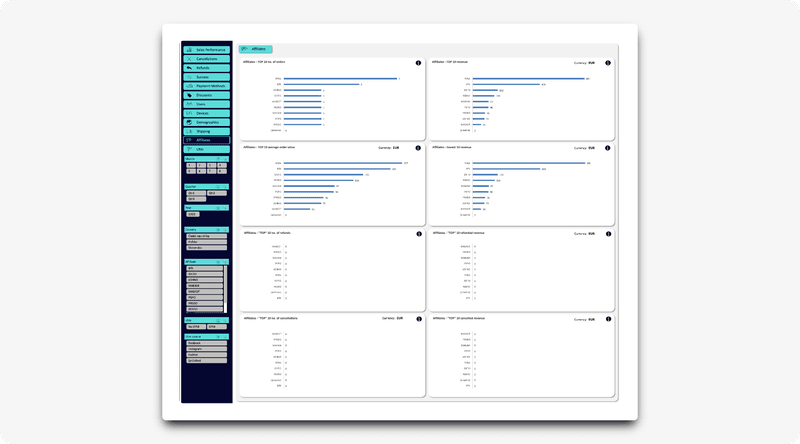
What affiliate metrics can you track with WooCommerce? None directly in analytics. That's why we've moved this data analysis to the Business Data Analytics for WooCommerce – Orders Dashboard, where you can see the "Affiliates" tab.
Affiliates metrics
- Affiliates TOP 10 – number of orders
- Affiliates TOP 10 – revenue
- Affiliates TOP 10 – average order value
- Affiliates TOP 10 – lowest revenue
- Affiliates TOP 10 – number of refunds
- Affiliates TOP 10 – refunded revenue
- Affiliates TOP 10 – number of cancellations
- Affiliates TOP 10 – cancelled revenue
UTM tab
A UTM is a set of parameters (or UTM codes) added to URLs to identify and track website traffic generated by a specific marketing campaign and traffic sources (social media marketing, pay-per-click advertising campaigns, email, etc.). This parameter is useful when you're testing which promotional methods work best and to track the performance of specific pieces of content.
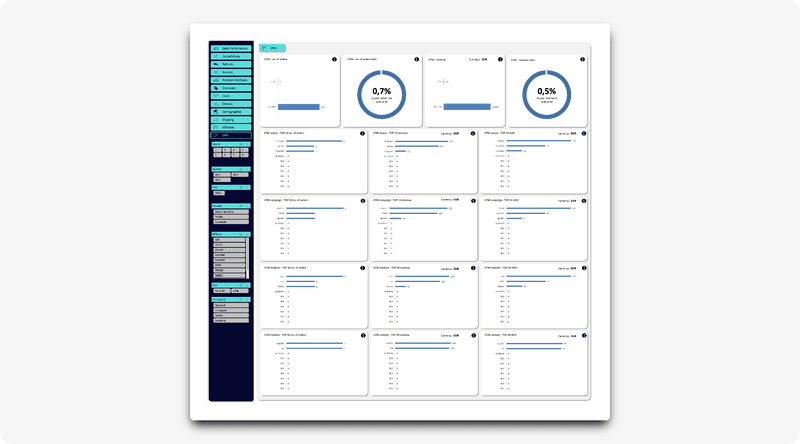
Google Analytics is a complex tool and WooCommerce collects UTM data in the background. But it doesn't show it to you externally in any way. Fortunately, there's the Business Data Analytics for WooCommerce – Orders Dashboard, which devotes a whole set of metrics to its “UTM” tab.
UTM metrics
- UTM – number of orders
- UTM – number of orders rate
- UTM – revenue
- UTM – revenue rate
- UTM sources – TOP 10 no. of orders
- UTM sources – TOP 10 revenue
- UTM sources – TOP 10 average order value
- UTM campaigns – TOP 10 no. of orders
- UTM campaigns – TOP 10 revenue
- UTM campaigns – TOP 10 average order value
- UTM medium – TOP 10 no. of orders
- UTM medium – TOP 10 revenue
- UTM medium – TOP 10 average order value
- UTM content – TOP 10 no. of orders
- UTM content – TOP 10 revenue
- UTM content – TOP 10 average order value
Business Data Analytics for WooCommerce – Items Dashboard
This dashboard looks at your WooCommerce business from the perspective of items (goods or services). It is an extension of the Business Data Analytics for WooCommerce – Orders Dashboard and is clearly divided into tabs.
Product Sales tab
It's always good to know which products are your best sellers. Several important business decisions can be derived from this information.
You can support these products with a larger advertising budget. People buy them, they are happy with them, so it makes good business sense to promote them to a wider audience.
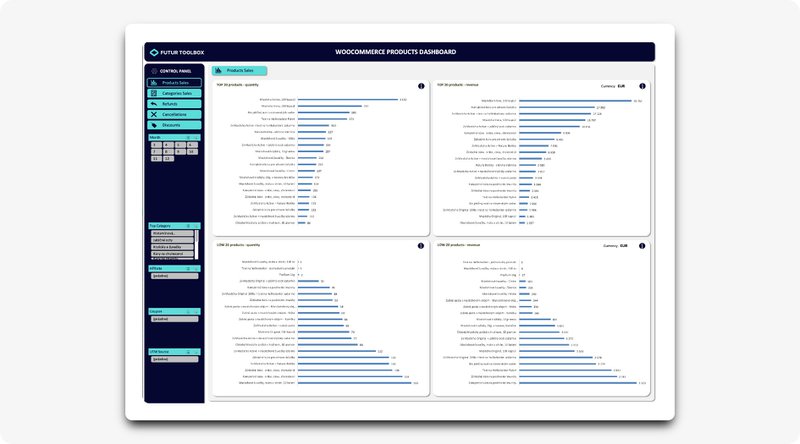
This data is provided to you by Business Data Analytics for WooCommerce – Items Dashboard in the “Products Sales” tab.
Product Sales metrics
- TOP 20 products – quantity
- TOP 20 products – revenue
- LOW 20 products – quantity
- LOW 20 products – revenue
Categories Sales
Product categorisation is a fundamental aspect of WooCommerce. It helps customers navigate and find the products they are looking for. Categorisation is essential for providing a good user experience and increasing the likelihood of a customer making a purchase.
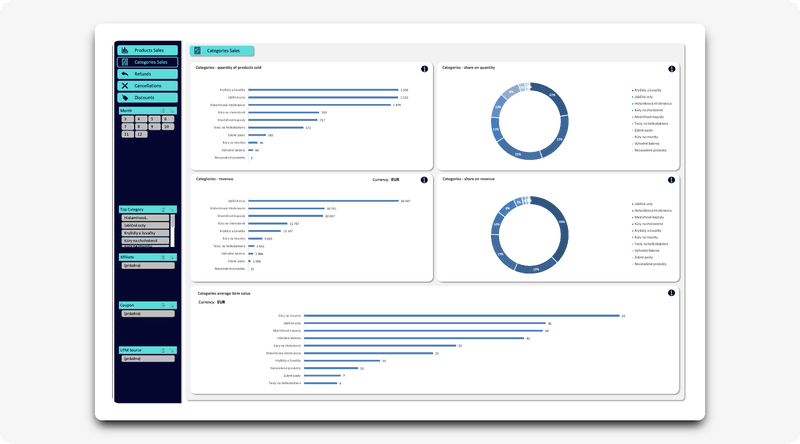
Whether it is marketing support for individual categories, adding a new product range, or the opposite, suppressing or removing a category, it is important that they are based on relevant data. You can see this data in the “Categories Sales” tab of the Business Data Analytics for WooCommerce – Items Dashboard.
Categories Sales metrics
- Categories – quantity
- Categories – share on quantity
- Categories – revenue
- Categories – share on revenue
- Categories – average item value
Refunds tab
In the world of WooCommerce, tracking product-level refunds is critical to the success and growth of any online business. Refunds are a fact of life for any e-commerce business, and it is important to understand and manage them in order to maintain profitability and customer satisfaction.
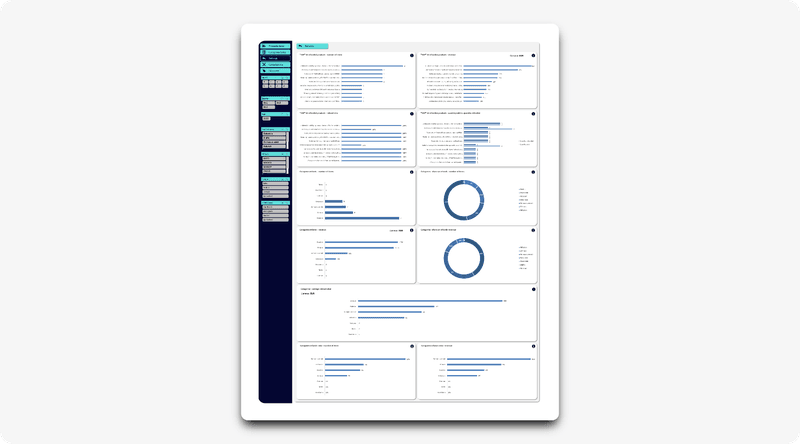
Product-level refunds are underrepresented in WooCommerce. And that's a shame, because it's a valuable source of information for your next decision. That's why we've created the Business Data Analytics for WooCommerce – Items Dashboard with a “Refunds” tab.
Refunds metrics
- TOP 10 refunded products – quantity
- TOP 10 refunded products – revenue
- TOP 10 refunded products – refund rate
- TOP 10 refunded products – quantity sold vs quantity refunded
- Categories refunds – quantity
- Categories refunds – revenue
- Categories refunds – rate
Cancellations tab
Tracking product-level cancellations in e-commerce is critical to understanding customer behaviour and making informed business decisions. By analysing cancellation data at the product level, you can identify which products are causing the most problems for customers and take steps to address these issues.
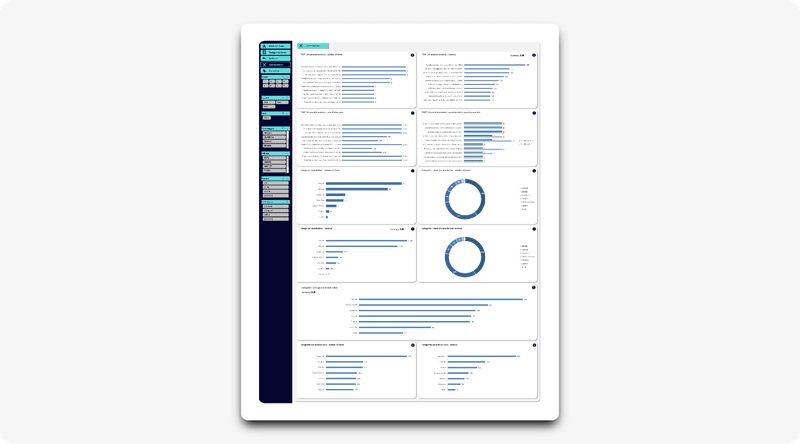
It is important for you to have cancellations under control, to know their values and trends so that you can react in time. With the Business Data Analytics for WooCommerce – Items Dashboard, you get the most important metrics you can track for your informed decision-making. Just click on the "Cancellations" tab.
Cancellations metrics
- TOP 10 cancelled products – quantity
- TOP 10 cancelled products – revenue
- TOP 10 cancelled products – cancellation rate
- TOP 10 cancelled products – quantity sold vs quantity cancelled
- Categories cancellations – quantity
- Categories cancellations – revenue
- Categories cancellations – rate
Discounts tab
Tracking discounts at the product level is essential. It helps you better understand customer behaviour and make informed decisions about inventory, pricing and marketing.
Your WooCommerce store offers several ways to work with discounts. The most common of these is working with coupons, which gives your prices a high degree of flexibility.
However, the platform itself provides you with minimal information about how much or how little you use discounts, which products and categories you apply them to the most.
The Business Data Analytics for WooCommerce – Items Dashboard solves this problem. Thanks to four simple charts in the “Discounts” tab, you have everything you need in one place.
Discounts metrics
- TOP 10 highest average discount per item
- Average discount per category
- TOP 10 product coupons – quantity
- TOP 10 product coupons – generated revenue
Conclusion
Data analysis is a critical component of your WooCommerce business. By analysing data, you can gain valuable insights into customer behaviour, sales patterns, and market trends, which can be used to make informed business decisions and optimise marketing strategies. By tracking key performance indicators and monitoring marketing campaigns, you can ensure that your e-commerce business is healthy and competitive.
WooCommerce is a great platform for selling products, but it has big gaps when it comes to data analysis. But now you have a simple, easy-to-use and affordable tool. In one place, you have over 100 metrics to help you understand your business and improve the performance of your WooCommerce store.
We are constantly developing this app and new relevant metrics will be added over time.


